The Net Promoter Score (NPS)
What Is Net Promoter Score (NPS)?
 Graphics courtesy of ReviewProOpens in new window
Net Promoter is both a loyalty metric and a discipline for using customer feedback to fuel profitable growth in your business. |
The Net Promoter Score, or NPS, is a core measurement or method that most companies use to measure overall customer satisfaction. It shows customer health and loyalty. It is also a lead indicator or prediction of future product adoption and growth.
Developed by Satmetrix, Bain & Company, and Fred Reichheld, the concept was first popularized through Reichheld’s book The Ultimate Question, and has since been embraced by leading companies worldwide as the standard for measuring and improving customer loyalty.
Fred Reichhelds’ 2006 book, The Ultimate Question, challenged the conventional wisdom of customer satisfaction programs.
It coined the terms bad profits and good profits and pointed to a faster, much more effective way of gauging customers’ real loyalty to a company, introducing a quantitative measure (the Net Promoter Score) for establishing a baseline and effectively tracking changes in customer loyalty. To explain:
The right goal for a company is to deliver customer experiences of such high quality that customers recognize the value in the relationship and become Promoters. These Promoters generate good profits and fuel true growth. They become, in effect, part of a company’s marketing department, not only increasing their own purchases but also providing enthusiastic referrals.
By contrast, companies can boost short-term profits by exploiting customer relationships, raising prices when they can get away with it, or cutting back on services to save costs and boost margins. Those practices boost bad profits by extracting value from customers at the expense of loyalty, creating Detractors. Companies cannot achieve long-term sustained growth on the basis of bad profits.
Conventional accounting can’t distinguish a dollar of good profits—the kind that lead to growth—from a dollar of bad profits, which undermine it. The Net Promoter Score fills this gap. Just as managers use financial reporting to make sure they are meeting profit goals, they can use NPS to make sure they are meeting customer relationship goals. Therein lies the path to true growh. (Reichheld, The Ultimate Question, p. 28)
Reichheld’s The Ultimate Question builds on the link between Net Promoter Scores and business growth and profitability. It was an easy read that helped me to find a way to combine our operational discipline to increase Promoters and reduce Detractors.
The Net Promoter concept can foster a potential win-win for business operators and their customers because it offers rapid access to data near-real-time metrics closely coupled and correlated with precipitating actions. Instead of waiting months for a long, drawn-out surveying, analysis, and interpretations, the system can help you initiate positive changes if you apply it correctly.
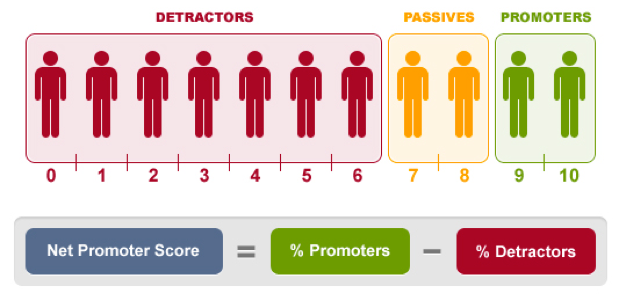
You might have probably participated in one or two NPS surveys, either online, in an email, or over the phone. The method is to ask, “How likely are you to recommend our product to a friend or colleague?” The answers are on a scale from zero to ten.
Answers from zero to six, are considered pretty unhappy customers. These are called “Detractors.” They can “churn” easily, and hinder growth by sharing their feelings with other colleagues, customers, or online. Detractors can give your brand a bad reputation.
Scores from seven to eight are called “Passives.” That means they are satisfied, but not completely committed to your product. They are indifferent and are susceptible to competitors who may make them an offer they can’t refuse.
The top scores of nine and ten are your “Promoters.” These customers are loyal and enthusiastic about your product, and will most likely renew, or buy more. They are also going to refer you to other people.
Calculating Your NPS Score
NPS is based on the fundamental perspective that every company’s customers can be divided into three categories:Promoters, Passives, and Detractors.
By asking one simple question, “How likely is it that you would recommend [Company X] to a friend or colleague?” you can track these groups and get a clear measure of your company’s performance through its customers’ eyes. Customers respond on a 0 – 10 point rating scale and, as mentioned earlier, are categorized as follows:
- Promoters (score 9 – 10) are loyal enthusiast who will keep buying and refer others, fueling growth.
- Passives (score 7 – 8) are satisfied but unenthusiastic customers who are vulnerable to competitive offerings. (Remember my sandwich experience?)
- Detractors (score 0 – 6) are unhappy customers who can damage your brand and impede growth through negative word-of-mouth. (Remember my Madrid example and my use of Twitter to complain from the Holiday Inn lobby?)
To calculate your organization’s Net Promoter Score, take the percentage of customers who are Promoters and subtract the percentage who are Detractors.
Net Promoter programs are not traditional customer satisfaction programs, and simply measuring your NPS does not lead to success. Companies need to follow an associated discipline to drive improvements in customer loyalty and enable profitable growth. They must have leadership commitment, and the right business processes and systems in place to deliver real-time information to employees, so they can act on customer feedback and achieve results.
Asking the ultimate question allows your business organization to track promoters and detract promoters and detractors, producing a clear measure of your organization’s performance through its custoemers’ eyes, its Net Promoter Score. Bain analysis shows that sustained value creators—companies that achieve long-term profitable growth—have Net Promoter Scores two times higher than the average company. And NPS leaders outgrow their competitors in most industries, by an average of 2.5 times.
Customers can be categorized based on their answers to the ultimate question. The best way to gauge the efficiency of a company’s growth engine is to take the percentage of customers who are promoters (P) and subtract the percentage who are detractors (D). This equation is how we calculate a Net Promoter Score for a company.
| P – D = NPS |
Although easy to grasp, the NPS metric represents a radical change in the way companies manage customer relationships and organize for growth. Rather than relying on notoriously ineffective customer satisfaction surveys, companies can use NPS to measure customer relationships as rigorously as they now measure profits. What’s more, NPS finally enables CEOs to hold employees accountable for treating customers properly. It clarifies the link between the quality of a company’s customer relationships and its growth prospects.
How does your firm stack on this measurement? How do your managers and sales team stack up? The average firm sputters along at an NPS efficiency of only 5 – 10%. According to this estimate, promoters barely outnumber detractors. Many firms, and some entire industries, have negative Net Promoter Scores, which means that they are creating more detractors than promoters, day in and day out.
These abysmal Net Promoter Scores explain why so many companies can’t deliver profitable sustainable growth, no matter how aggressively they spend to acquire new business. Companies with the most efficient growth engines—companies such as Amazon, HomeBanc, eBay, Harley-Davidson, Costco, Vanguard, and Dell—operate at NPS efficiency ratings of 50-80%. So even they have room for improvement.
In concept, it’s just that simple. But obviously, a lot of hard work is needed to both ask the question in a manner that provides reliable, timely, and actionable data, and, of course, to learn how to improve your Net Promoter Score.
See Also:
- Weinstein, A. (2002). Customer retention: a usage segmentation and customer value approach. Journal of Targeting, Measurement and Analysis for Marketing, 10(3), 259 – 68.
- Reichheld, F.F. (1996). The loyalty effect: the hidden force behind growth, profits, and lasting value: Boston, MA: Harvard Business School Press.
- Coyles, S. and Gorkey, T. C. (2002). Customer retention is not enough. McKinsey Quarterly, No. 2, 80 – 9.
- Based on Reichheld, F. F. and Sasser, Jr, W.E. (1990). Zero defections: quality comes to services. Harvard Business Review, Sept – Oct., 105 – 11; Reichheld, F.F. (1996). The loyalty effect.Boston, MA: Harvard Business School Press.
- Bolton, R.N. (1998). A dynamic model of the duration of the customer’s relationship with a continuous service provider: the role of satisfaction. Marketing Science, 17(1), 45 – 65.
- Kano, N. (1995). Upsizing the organization by attractive quality creation. In G.H. Kanji (ed.). Total Quality Management: proceedings of the First World Congress. London: Chapman Hall.
- Vivek, S.D., Beatty, S.E. and Morgan, R.M. (2012). Customer engagement: exploring customer relationships beyond purchase. Journal of Marketing Theory and Practice, 20(2), 127 – 45.
- Keaveney, S.M. (1995). Customer switching behavior in service industries: an exploratory study. Journal of Marketing, 59, 71 – 82.