File photo. The Developmental Stages of a Child (Online Psychology Degree Guide, 2021)
In all studies which describe behavioral changes with age, one of two general developmental designs, either the cross-sectional or the longitudinal, are used. Here we discuss the strengths and weaknesses of these designs. Many examples of research using these designs are presented later in the literature.
There is a third approach—the sequential design—which often gives a partial solution for the limitations imposed by the use of only one method.
Cross-sectional designs
Cross-sectional design is a study where children of different ages are observed at a single point in time.
In a cross-sectional design people of different ages are tested once; thus, each point on the X-axis (the horizontal axis of graphs, such as those shown in Figure X-1 is represented by a different age group. This is the most common method employed by developmental researchers because it is the least time-consuming and provides a quick estimate of changes with age. However, it only describes age differences.
There is no way to derive an estimate of the continuity or discontinuity of various processes over age (e.g., stability of personality; sudden shift in language comprehension or production) because performance is averaged over different individuals at each age.
Longitudinal designs
Longitudinal design is a study where more than one observations of the same group of children is made at different points in their development.
In longitudinal designs people are tested repeatedly as they grow older. This method is powerful because each individual’s development is measured over time, allowing one to assess within-person changes with age and between-person differences in age changes.
In many cases the data are summarized by plotting the group average as a function of age; but, by looking at each individual’s data, we can determine if there is a gradual change with age or a sudden shift in performance more characteristic of stage-like development.
There are many types of longitudinal designs. They may take place over a long period of time. An example is the Avon Longitudinal Study of Parents and Children (ALSPAC)Opens in new window. This is a large-scale study of children born in Avon, UK, in the early 1990s, which recruited over 14,000 pregnant mothers-to-be, and is a major resource for the study of genetic and environmental factors contributing to long-term health and development.
To date, ALSPAC findings have been reported in over 700 scientific publications (Boyd et al., 2013). At the other extreme there are microgenetic studies in which typically only a few children are tested over a short period of time: examples of such studies are given in the next section.
Unfortunately, there are several problems with longitudinal designs as well, particularly studies such as ALSPAC. The cost is very high in several respects. They are time-consuming, it may be difficult to schedule repeated visits of the same children, and the drop-out rate can be very high.
If those who find the task difficult or leave the area withdraw from the study, this participant attrition, with the accompanying selective survivorship of the remaining children in the sample, can produce a population bias that can give a misleading impression of development and may limit the generality of the results.
Another major problem can be the time it takes to complete a study — it equals the age span being tested. If, for example, the task is to map changes in performance on IQ tests between age 20 and 80, it would take 60 years to complete the study! And, after all that work, the results may only be true for the particular age cohort studied (those born at about the same time), producing yet another population bias.
Cohort is a group of people who were raised in the same environment or who share certain demographic characteristics.
There is one final problem we can mention, which is the possible effects of repeated testing — children might get better over age simply because they have more practice on the tasks they are given! As a result, the data might not reflect typical development in the absence of this repeated practice.
Microgenetic methods
A combination of procedures that are becoming increasingly popular are referred to as the microgenetic method.
Microgenetic method is a method that examines change as it occurs and involves individual children being tested repeatedly, typically over a short period of time so that the density of observation is high compared with the typical longitudinal study.
Developmental psychologyOpens in new window is fundamentally concerned with change, and with the causes and consequences of change. However, most research, whether using cross-sectional, longitudinal or other design, provides a snapshot of developmental changes, without describing the process of change itself (Flynn, Pine & Lewis, 2006).
Microgenetic methods examine change as it occurs, and involve individual children being tasted repeatedly, typically over a short period of time, so that the density of observations is high compared with the typical longitudinal study. Thus, the method provides detailed information about an individual, or individuals, over a period of transition.
The microgenetic method has been used in many areas of development, which include arithmetic, theory of mindOpens in new window, locomotion, memory, analogical reasoning, strategy use, conscious and unconscious reasoning, and, quite simply ‘By examining change as it occurs this method can yield more precise descriptions than would otherwise be possible’ (Flynn et al., 2006, p.154).
When longitudinal and cross-sectional results tell a different story
Usually researchers try to obtain both longitudinal and cross-sectional data on any topic. In general, we expect to obtan similar developmental functions from cross-sectional and longitudinal data, and usually this is the case. However, this does not always happen, and the two designs can sometimes give us dramatically different results. Two instances of conflicting results will be discussed; the first concerns the length of time between measures (the age scale) and the second concerns cohort effects.
Time between meatures
In designing a developmental study one must decide what intervals to use on the X-axis, that is, at what ages the children are to be tested or how often repeated tests will be administered.
When studying infants, it is common to test them monthly or bi-weekly in longitudinal studies, depending on when we expect to see an age difference in performance appear.
The transition point for changes in performance with age can be estimated using cross-sectional data. While this may be appropriate in most cases, sometimes different distances between test ages can result in very different developmental functions.
An interesting example involves physical growth, which is represented as a continuous, increasing growth curve. This is shown in Figure X-1, where the filled circles connected by a solid line have been estimated from a normative study Bobson and Benda (1976) which is based on a combination of cross-sectional and longitudinal data.
The function looks continuous, and the shape matches the monthly longitudinal data they reported for a few ‘normally’ growing individual infants. By contrast, a discontinuous step-like function was found by Lampl et al. (1992) when they made daily or weekly measures of the growth in the length of a small number of infants during the first 21 months from birth.
Lampl et al. analyzed individual growth functions and discovered that the main change in length occurred in sudden bursts followed by longer periods of no change, and they suggests that 90–95 per cent of development during infancy is growth free, and that throughout development continuous growth charts do not represent how individuals grow (Lampl & Thompson, 2007).
Indeed, in daily measures, children were found to grow substantially, as much as 1 centimetre, in a sudden burst, in mnay cases overnight, and then not change for an average of 12 days. This is shown in Figure X-1 where a summary of the growth pattern of one infant in Lampl et al.’s study is pictured by the thin line overlaying Babson and Benda’s normative curve.
Figure X-1 A comparison of the continuous-growth function for length/height derived from averaged data from cross-sectional studies (the solid line connected by the filled circles) with the step-like function (sudden increases in length followed by periods of no growth) derived from daily measures on individual infants.
This may come as no great surprise to some parents who report that their babies seemed suddenly to outgrow their sleeper (or ‘babygrow’) overnight!
The main point is that according to Lampl et al. changes in size occur in a discontinuous progression with the most common state being ‘no change’ at all. This developmental function is not revealed unless frequent measures are taken on individuals. It should be noted that if all of Lampl et al.’s data were collapsed across individuals and plotted as a function of monthly age groups, the curve probably would look like Babson and Benda’s continous age function.
Cohort effects
A serious design problem, which is particularly relevant for studies covering a large age range, involves cohort effects. This is where there are changes across generations in the characteristic one is interested in. The following are a few examples of such effects.
Height: the average height of the Western 20-year-old male has risen from around 5 ft 7 in (1.52 m) in the early 1900s to around 5 ft 10 in (1.78 m) by 2015. This has resulted from gradual improvements in diet and medical care which make foetal life in the womb and post-natal life healthier.
Attitudes: There have been many changes in important psychological characteristics over generations. Consider, for example, current attitudes towards homosexuality — how do you think they have changed over the last 50 years?
Leisure activities: Western children spend much more time in sedentary activities, such as watching television, playing video games, surfing the internet, etc. than their counterparts of 50 or 60 years ago, for whom such activities simply didn’t exist.
Everyday life: Huge changes have occurred in everyday life in recent generations which combine to produce substantial intergenerational psychological changes.
In addition to changes in leisure activities consider the impact of better, more affordable cars and better transport in general, household appliances as washing machines and televisions, electronic devices such as computers, mobile phones, iPods – the luxuries of yesteryear become today’s necessities and, of course, electronic devices were not available a generation ago.
Intelligence: In much the same way that height has increased over generations, so too has measured intelligence (intelligence quotient or IQ as measured by intelligence tests). This means that the findings from early cross-sectional studies gave a different account of the development of intelligence across the life span than more recent studies — these findings are described in the next section.
Sequential designs
One possible way of investigating the different findings that might result from longitudinal and cross-sectional designs is with the use of what are called sequential or age/cohort designs. These studies involves a combination of designs, and are fairly rare (in large part because of the costs and time involved).
We will illustrate this design with a schematic drawing of performance on one intelligence test (known as visualization performance — the precise details of the test are not important for our purpose), adapted from Nesselroade et al., 1972, which is shown in Figure X-2. In this figure, adults in five different age groups (30, 37, 44, 51 and 58 years — the cross-sectional aspect of the study) were tested twice (seven years apart — longitudinal part) giving us overlapping age groups.
Figure X-2 The use of a sequential design with an intelligence test demonstrates that different results can emerge from cross-sectional findings (the cohort effect shown by the downward sloping dotted line) and longitudinal findings (the solid lines).
The results show two effects. There is a cohort effect, resulting from testing different adults of different ages at about the same time: this is the lower performance by the older age groups, illustrated by the dotted line connecting the cross-sectional data.
There is also a contrasting, longitudinal effect, where the same individuals tested at two ages show a slight improvement in performance over age, illustrated by the solid lines connecting each pair of longitudinal points for the five age groups. Thus, IQ scores have been increasing over generations, a phenomenon referred to as the Flynn effect.
However, when the same individuals are tested over time their scores remain relatively static. Thus, intelligence does not decline with age, but the environment has improved over successive generations.
Although sequential designs are not used often, when they are used they provide a measure of individual differences and reveal whether or not longitudinal and cross-sectional results agree. We now turn to an account of the different research methods which are used to collect data on children’s development.
Research Methods for Studying Infants' Development
The research designs that we have discussed always incorporate one or more developmental research methods in order to investigate development. Developmental psychologists employ a variety of methods, some of the most important are: observational studies,Opens in new windowexperimental methodsOpens in new window, psychological testing and correlational studies.

.webp) File photo. The Developmental Stages of a Child (Online Psychology Degree Guide, 2021)
File photo. The Developmental Stages of a Child (Online Psychology Degree Guide, 2021)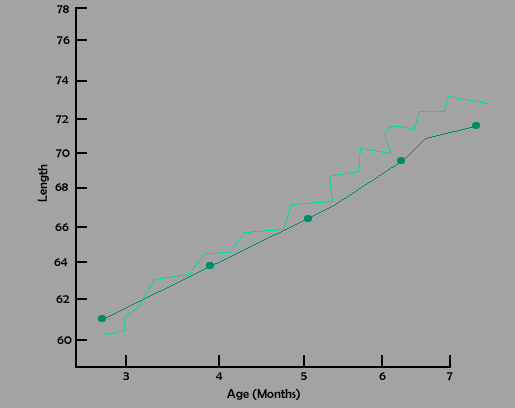 Figure X-1 A comparison of the continuous-growth function for length/height derived from averaged data from cross-sectional studies (the solid line connected by the filled circles) with the step-like function (sudden increases in length followed by periods of no growth) derived from daily measures on individual infants.
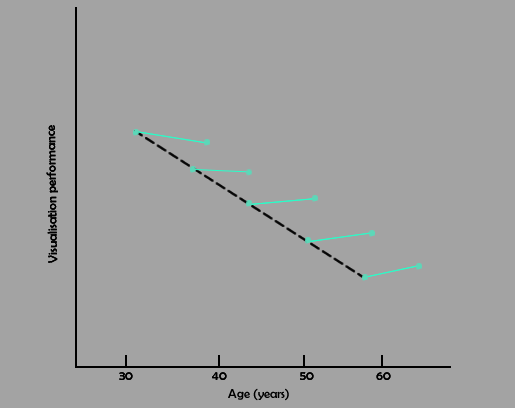 Figure X-2 The use of a sequential design with an intelligence test demonstrates that different results can emerge from cross-sectional findings (the cohort effect shown by the downward sloping dotted line) and longitudinal findings (the solid lines).