Developmental Functions
Developmental Functions: Growing and Changing
 File photo | Credit: Johns HopkinsOpens in new window
Development is the study of change across the lifespan. Patterns of developmental change begin at conception and continue through until death. These include physical, neural, physiological, and behavioral changes that all occur in distinct ways depending on the period of development. |
Some patterns of developmental change are biologically driven, which means they are caused by genes or physiology, and some are environmentally driven, meaning they are influenced by things in the person’s environment, including parents, siblings, peers, and neighborhoods; most changes are the product of the interactions between biology and environment.
From the data that developmental psychologists collect, analyse and interpret, it is possible to describe a number of developmental functions, or developmental trends — that is, the ways in which humans typically grow and change with age.
Developmental functions are typical trends in development; for example, we typically get more intelligent as we age.
Developmental functions are presented in graphs similar to those in Figure X-1. Usually, the measure of behavior (or behavioral change) is represented on the vertical, Y-axis, and age or time is on the horizontal, X-axis.
- The practical value of such functions is that they allow us to detect unusual developmental patterns (e.g. developmental delays) and to intervene with treatment as and when appropriate.
- The theoretical value is that the data can be used to evaluate hypotheses derived from various theoretical perspectives by comparing theoretical schematic plots such as those in Figure X-1 with empirically derived functions, where the latter are the data that are collected.
Human development of course is extremely complex, and indifferent aspects of development grow and change in different ways. Figure X-1 shows five of the most commonly found functions, and we will give examples of development which match each of them.
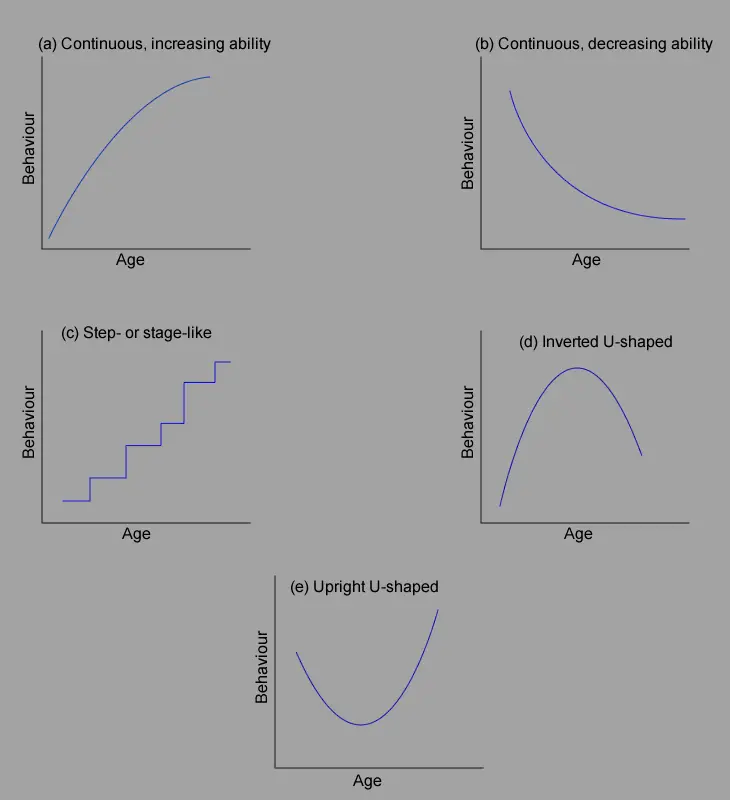 Figure X-1 Five of the most common developmental functions, illustrating the ways in which people typically grow and change with age: (a) continuous, increasing ability; (b) continuous, decreasing ability; (c) step – or stage-like; (d) inverted U-shaped; and (e) upright U-shaped. Usually (as here), the measure of behavior, or changes in behavior, is represented on the vertical, Y-axis, and age or time is on the horizontal, X-axis.
 |
Continuous function (a) – increasing ability
Continuous function — increasing ability is behavior that improves with age. For example, during the first year of life the precision with which infants reach for objects increases.
Perhaps the most commonly developmental function found in textbooks is the one shown in Figure X-1(a) in which we simply get better, or increase in an ability or quantity with age.
Examples include the negatively accelerating change in the height and weight of children which increase rapidly during the first few years of life, more gradually during childhood, and level off after adolescence.
We should note that although height and weight are typically considered to be continuous in their development, research by Lampl et al. mentioned earlier (see Figure X-1) suggests that changes in height might be discontinuous at times.
Another example with a shorter timescale is the precision in reaching for and grasping an object, which gradually increases during the first year of life as infants practice and receive feedback from their errors.
Intelligence is another example – as children grow older they become more intelligent, and this levels off during adolescence. We will return to the development of intelligence (and whether its development is continous or discontinuous!) when we compare developmental functions.
Continuous function (b) – decreasing ability
Continuous function — decreasing ability is behavior that gets worse as we age. For example, young infants can initially distinguish non-native speech sounds very easily; however, for many sounds they lose this ability after their first year of life.
It seems odd to think of aspects of development where we get worse rather than better as we grow up! As you can imagine there are few of these developmental functions. The clearest example is found in speech perception in early infancy.
Research by Janet Werker and her colleagues has demonstrated that young infants, around 6 months of age, are able to discriminate almost every slight variation in sound (that is, the phonetic contrast between different phones, however similar sounding they seem), but that this broad-based sensitivity declines by the time the infant is around 1 year old (the time babies produce their first meaningful word).
That is, as a result of their experience with their native language, and particularly as they begin to utter meaningful words, infants lose the ability to make many phonetic discriminations that are not used to differentiate between words in their native language.
For example, both the [k] sound in ‘key’ and the [k] sound in ‘ski’ are different phones, but members of the same phoneme in English, and English speakers hear them as the same sound. In contrast, the two [k] sounds are members of different phonemes in Chinese. As a result, speakers of Chinese can readily discriminate between the two sounds.
Conversely, the [r] sound as in ‘very’ and the [1] in ‘loud’ are different phones in English and speakers of Chinese differ in terms of their ability to discriminate sounds. As Werker (1989) puts it, infants become exquisitely tuned to the properties of the native language – they are “becoming a native listener”.
Discontnuous (step) function
Discontinuous (step) function is where development takes place in a series of stages, where each new stage appears to be qualitatively different from the preceding (and following) stages.
A second, common function is where development takes place in a series of stges, where each new stage appears to be qualitatively different from the preceding (and following) stages (Figure X-1(c)).
It is easy to describe different major stages in the human lifespan such as infancy, preschool childhood, middle childhood, adolescence, adulthood and old age: thus, infancy is the period “without language”, there are clear biological changes occurring at puberty, and so on.
Stages of development are found in many areas of development. Piaget’s theory is the most famous example of a stage theory of development. In his theory the child’s thinking from one stage to the next involves different structures, and undergoes qualitative change: the young child will believe in Father Christmas, but this belief disappears around age 7; the adolescent, but not the younger child, is capable of abstract thought.
A stage-like progression of specific skills or processes also exists, such as in the development of mobility in the infant. Here the vertical, Y-axis on a graph could be distance travelled by an infant, which suddenly accelerates at different points in time matching the onset of various mobility accomplishments.
Infants are relatively immobile during the first few months of life, begin to crawl around 6 – 8 months of age, stand up and toddle around furniture a few months later, and begin to walk on their own between 12 – 18 months of age (the time at which parents move all small objects out of the infant’s reach!)
The onset of these mobility milestones seems to occur rather abruptly, and each one represents a qualitatively different type of locomotion suggesting a stage-like progression.
Another example is the development of speech — an initial period of no word production is followed by a period of babbling beginning around 9 months of age when infants make speech-like sounds in a flowing “conversation” which contains no words.
Infants begin to use single words around 12 months of age, produce two- to three-word phrases at about 18 months and, finally, produce complex grammatical sentences. These major milestones, which appear to be qualitatively different, also have been conceptualised as stages.
Many other step-like functions have been described, for example in the child’s acquisition of a theory of mindOpens in new window, in the moral judgement stages.
U-shaped functions
Two other types of developmental functions are inverted and upright U-shaped functions.
U-shaped functions is behavior where ability is initially very good, then decreases, and then increases again follows a U-shaped function of development. An inverted U-shaped function follows the opposite trend, initially poor, then getting better, and then becoming poor again.
When we consider development across the lifespan, an inverted U-shaped developmental function, illustrated in Figure X-1(d), is commonly observed. One example is the development of visual acuity which is poor at birth, increases rapidly during the first few months of life, and diminishes during the latter part of the lifespan.
Inverted U-shaped functions can also be found during shorter time periods. For example, babbling is not present at birth, emerges around 6 months of age, and disappears without a trace a few months later. Of course, some might argue that it does emerge again during adulthood – perhaps during university lectures!
Inverted U-shaped functions are extremely common in development — we improve in the early years, stabilise or level off in adulthood, and get worse as we get older! Biological as well as psychological development often shows this function: thus, we reach our muscular and athletic peak in adolescence and early adulthood, and from about 30 years of age or thereabouts our abilities decline.
The other U-shaped function, shown in Figure X-1(e) involves abilities which may be present early in life and disappear to re-emerge at a later age. One example is the ability of newborn infants to turn their heads and eyes towards sounds. This dramatic auditory localization response is present at birth, diminishes or disappears at around 6 weeks of age, and reappears again around 4 months of age (Muir et al., 1994).
Another example is the common observation that infants will display coordinated alternating step-like movements at birth, if they are supported in an upright position and held so that the soles of their feet are touching a solid surface. This amazing ability seems to disappear when infants are about 2 months old and reappeas again when they begin to stand and walk, around 12 months of age.
This “stepping reflex” gives the impression that the baby is “walking” (Zelazo, 1983), and it was only a few years ago that some “experts” were encouraging parents to keep exercising this stepping response in very young infants with the assumption that they would then learn to walk earlier.
For a long time it was believed that the stepping reflex and later walking were qualitatively different, both in the underlying brain systems and in the pattern of muscular coordination, but Thelen and Fisher (1982) offered a more plausible “heavy legs” interpretation, that the behavior declined simply because the infants accumulated more fat in their legs making it more difficult for them to produce the stepping response; certainly, under some circumstances the respons is easy to elicit in 2-month and older infants (Barbu-Roth et al., 2015).
Comparing Developmental Functions
It can be useful to plot more than one developmental function on the same graph. Possible causal relationship may be suggested by doing so. In the case of the U-shaped auditory localization function, Humphrey et al. (1988) compared the developmental functions for auditory localization responses and orientation to schematic faces, from birth to 5 months of age.
When there is a minimum in the performance of head turning to off-centred sounds (i.e. it is very difficult to elicit), there is a maximum in looking time at the faces. They speculated that competition between the two stimulus-response systems occurred, with the most rapidly changing system, visual attention, predominating.
Uttal and Perlmutter (1989) provide a number of comparisons between developmental functions for older children and adults which illustrate possible causal relationships. One example has to do with the maintenance of typing speed by professional typists as they age.
The developmental function tends to be flat over much of the life span. This is a puzzle because it is well known that as people age they have a slower reaction time, which should therefore slow down the typist’s keystroke speed. It turns out that as keystroke speed declines, older typists increase their letter span (the numer of words they code as a unit, which are tehn run off automatically by the fingers). This cognitive skill, which increases with practice, may compensate for the loss of keystroke speed.
We will make one final comparison, to do with the development of intelligence. Sometimes it is useful to think of intelligence as developing in a qualitative, stagelike manner (as in Figure X-1(c)).
However, sometimes it is convenient to think of intelligence as growing in a quantitative manner. This is the assumption that underlies most intelligence tests — as children get older they become able to solve, or answer, more and more of the items in the tests.
With this latter assumption we find that children’s measured intelligence (the raw scores they obtain on IQ tests) increases until adolescence, and then it levels off or stabilizes. And then what happens?
In the 1940s and 1950s there were many cross-sectional studies in which people of different ages, from young adults to the very elderly, were given the same intelligence tests. The clear finding was that the development of intelligence followed an inverted-U function (as in Figure X-1(d)) — people simply got less intelligent as they approached middle- and old-age.
However, during the 1950s and the findings from longitudinal studies, in which the same people had been tested over many years, began to emerge. These findings were that intelligence did not decrease as people got older, rather scores on intelligence tests have simply been increasing over generations, most likely attributable to a number of factors which include improvements in nutrition, health and education, and smaller family size. As mentioned earlier, this is called the Flynn effect, named after James R. Flynn, the psychologist who documented it and described drawing its implications (Flynn, 1998, 2009; Lynn, 2009).
Interestingly, the Flynn effect seems to have reached its peak in Western countries, and is showing a small decline: one possible, disquieting reason for this is given by Holmes (2014, p. 32):
Most demographers agree that in the past 150 years in Western countries the most highly educated people have been having fewer children than is normal in the general population. The notion that less educated people are outbreeding others is far from new, as is the inference that we are evolving to be less intelligent.
See also:
- Babson, T., & Benda, G. (1976). Growth graphs for the clinical assessment of infants of varying gestational age. Journal of Pediatrics, 89, 814 – 820.
- Barbu-Roth, M. et al. (2015). Why does infant stepping disappear and can it be stimulated by optic flow? Child Development, 86, 441 – 455.
- Bushnell, I.W.R. (2003). Newborn face recognition. In O. Pascalis & A. Slater (Eds.) Face: The development of face processing in infancy and early childhood (pp. 41 – 53). New York: NOVA Science Publishers.
- Booth-LaForce, C., & Roisman, G.I. (2014). The Adult Attachment Interview: Psychometrics, stability, and change from infancy, and developmental origins. Monographs of the Society for Research in Child Development, 79 (Serial No. 3).
- Boyd, A., & Golding, J. et al. (2013). Cohort profile: The ‘Children of the 90s’ – the index offspring of the Avon Longitudinal Study of Parents and Children. International Journal of Epidemiology, 47, 111 – 127.
- Fifer, W. (2010). Prenatal development and risks. In G. Bremner & T. Wachs (Eds)., The Blackwell handbook of infant development. Oxford: Wiley/Blackwell.
- Lampl, M., & Thompson, A.L. (2007). Growth charts do not describe individual growth biology. American Journal of Human Biology, 19, 643 – 653.
- Hultsch, D., & Deutsch, F. (1981). Adult development and aging: A life-span perspective. New York: McGraw-Hill.
- Hepper, P. (2011).Prenatal development. In A. Slater, M. Lewis, G. Anzures, & K. Lee (Eds.), Introduction to infant development (Canadian end; pp. 36 – 56). Oxford: Oxford University Press.